A complete back office for a seller of home textiles on Wildberries, a major e-commerce marketplace: 763 product cards, 4 brands, about 6,000 orders a day, production in Uzbekistan with a ~60-day cycle. The system covers restock planning on TOC buffers, a daily pulse board, 7 alert types, an economics dashboard with a month-end forecast, set combinatorics, ABC analysis, a supplier order in one click, and as of this year FBS order assembly with marking-code scanning and a warehouse register.
A fast-growing seller of towels, bathrobes and textile sets. The numbers lived in three disconnected services. The most important decision of the business, what to restock and when, was made by hand.
The marketplace cabinet held orders and ads. MoySklad (an inventory SaaS) held warehouses and set recipes. TrueStats (a seller analytics service) held unit economics. Plus manual file exports. Nobody saw one picture.
Which SKU to move to the marketplace warehouse, how much and when: the owner decided this daily, in a personal Excel, across 763 product cards in ~27 categories. The process did not scale and did not survive a vacation.
Production takes about 60 days, plus ~10 days of delivery, plus domestic legs. Order too late and you miss the season. Order too early and you freeze cash in stock. The margin for error is small and shrinks in season.
Stockouts, order drops, negative reviews and data mismatches were noticed when someone happened to look. With 6,000 orders a day, "happened to look" is not a control system.
Every night Celery jobs pull the marketplace, the inventory SaaS and the analytics service into PostgreSQL. Calculation modules turn raw rows into buffers, alerts and forecasts. People work in a React SPA or in a Google Sheets showcase that the backend renders for them.
Contracts between modules mean nothing is computed twice: sufficiency comes from one function, the 33/67 traffic light from one settings row, ABC classes from one service. The pulse board, the Google showcase and the alerts all consume the same numbers.
The client asked to verify his own restock formulas and suggest improvements. His classic coverage math stayed in the table as visible columns. On top of it the system runs Dynamic Buffer Management (DBM): every SKU gets a target buffer, the buffer splits into traffic-light zones, and the buffer corrects itself from actual consumption. This is textbook TOC, implemented as code and tests.
The ×1.1 is the client's paranoia margin on every buffer, in the spirit of Goldratt. M is the DBM multiplier: it starts at 1.00 and moves in steps of 1/3.
The buffer is full enough. Do nothing. Twelve green days in a row will suggest shrinking the buffer: capital should not sleep in stock.
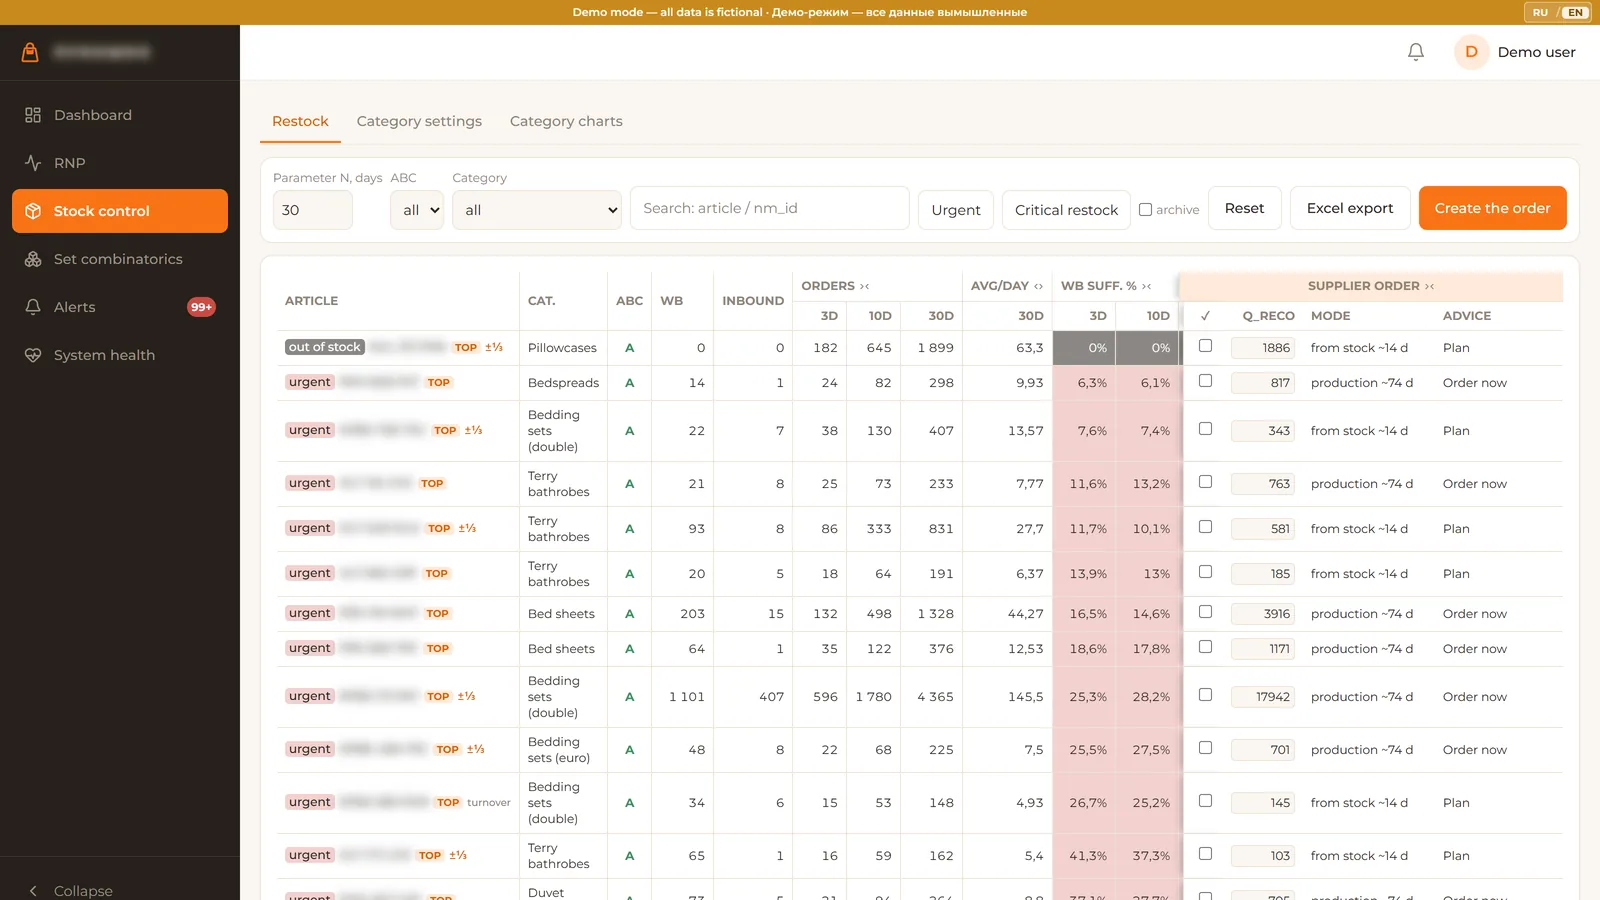
Plan replenishment. The SKU enters the restock table with a computed quantity, not a guess.
Order now. Red days accumulate in the 12-day history; a red streak triggers a buffer increase recommendation.
Stock is zero while sales run. Lost revenue every day. Black counts as red in the streaks and screams at the top of the alert feed.
| Constant | Value | Reasoning |
|---|---|---|
| DBM window | 12 days | Three times the replenishment leg to the marketplace warehouse (4 days). A shorter window reacts to noise, a longer one reacts too late. |
| Increase trigger | ≥80% red of 12 | A buffer that lives in red is not a buffer. Recommendation: +1/3 of the target. |
| Decrease trigger | 12 green in a row | A buffer that never leaves green is frozen cash. Recommendation: -1/3, and only a full unbroken streak counts. |
| Floor | M ≥ 1/3 | The multiplier never drops below one third. If a step would break the floor, the decrease is not even suggested. |
| Cooldown | 12 days | After any correction the system stays silent for a full window, so one decision is measured before the next one is proposed. |
| Paranoia | ×1.1 | The client's rule: +10% on every buffer. Encoded as a named constant, covered by tests. |
| Supply legs | 4 / 14 / 74 days | To the marketplace warehouse / from the producer's stock / from production (60-day cycle + 10 delivery + domestic legs). |
| TOP rule | 90% | The client's rule: an A-class SKU below 90% buffer always jumps to the top of the restock table, above any C-class SKU, and restocks to at least 90%. |
Each category has a season window and a coefficient. A manual coefficient set by the client always overrides the automatic hint. The hints come from last year's orders: weekly sums, 3-week smoothing, season = the segment above 50% of the peak.
Out of season the speed formula is ignored. The category holds a fixed stock in units, distributed across SKUs by their share of orders over 90 days. No sales history at all: split evenly.
In the closing window of the season the buffer ramps down linearly to a planned deficit. The season ends with empty shelves by design, not with a year of leftovers in stock.
Auto-apply of buffer corrections ships OFF by default. The daily job only writes a recommendation into the row: a ±1/3 button with a tooltip explaining why. The manager clicks, the change is logged, the cooldown starts. That is Goldratt's own discipline: buffers adapt, humans approve.
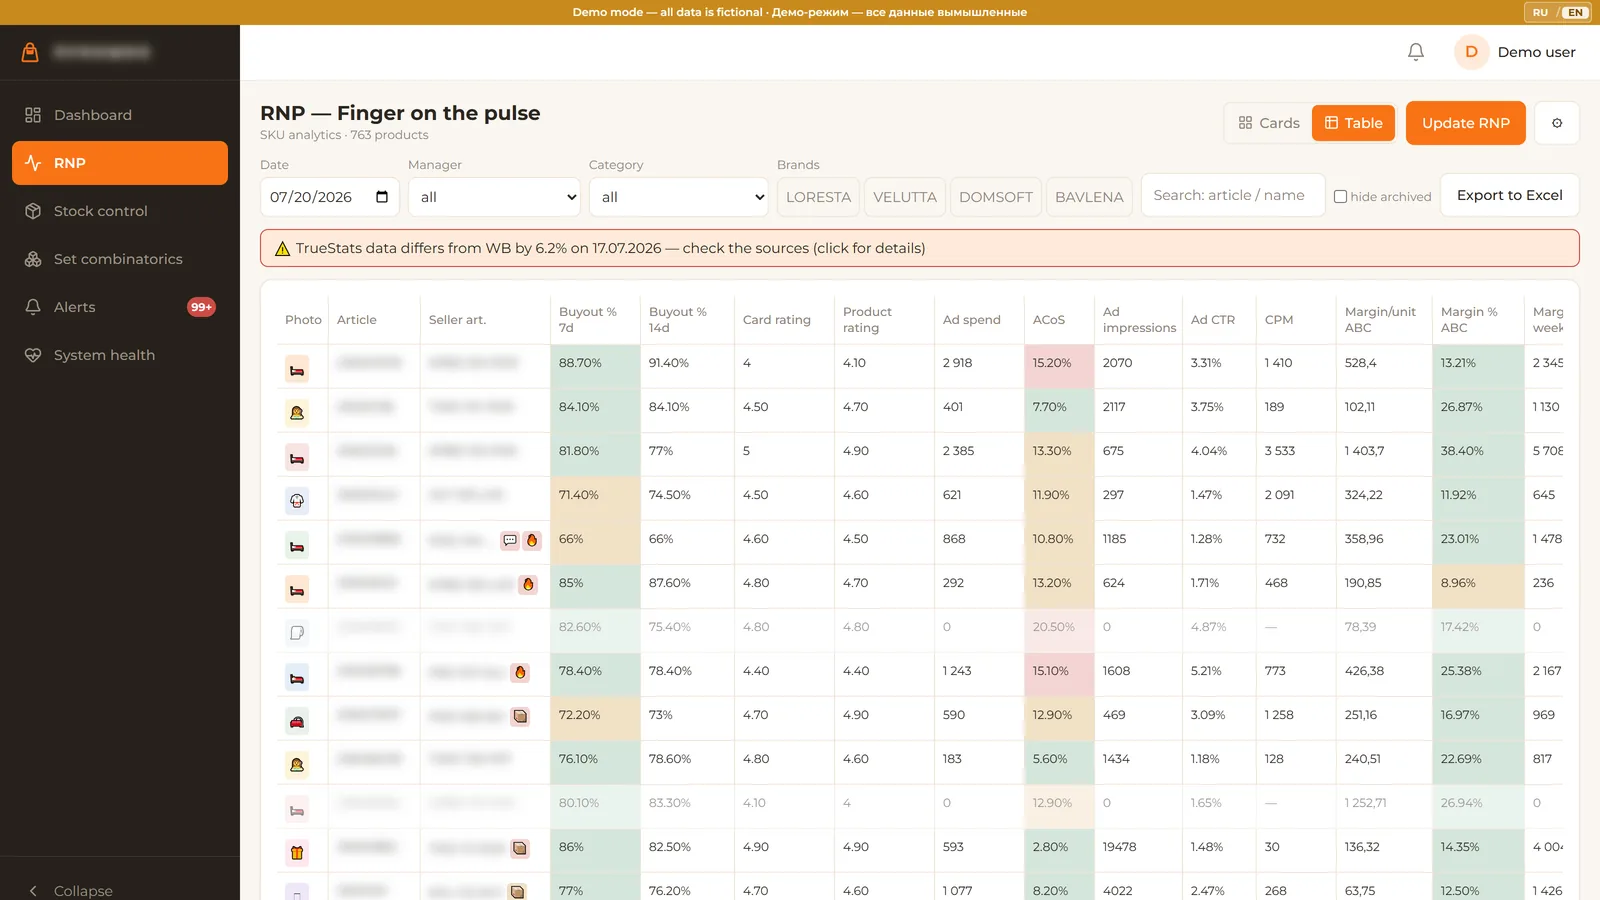
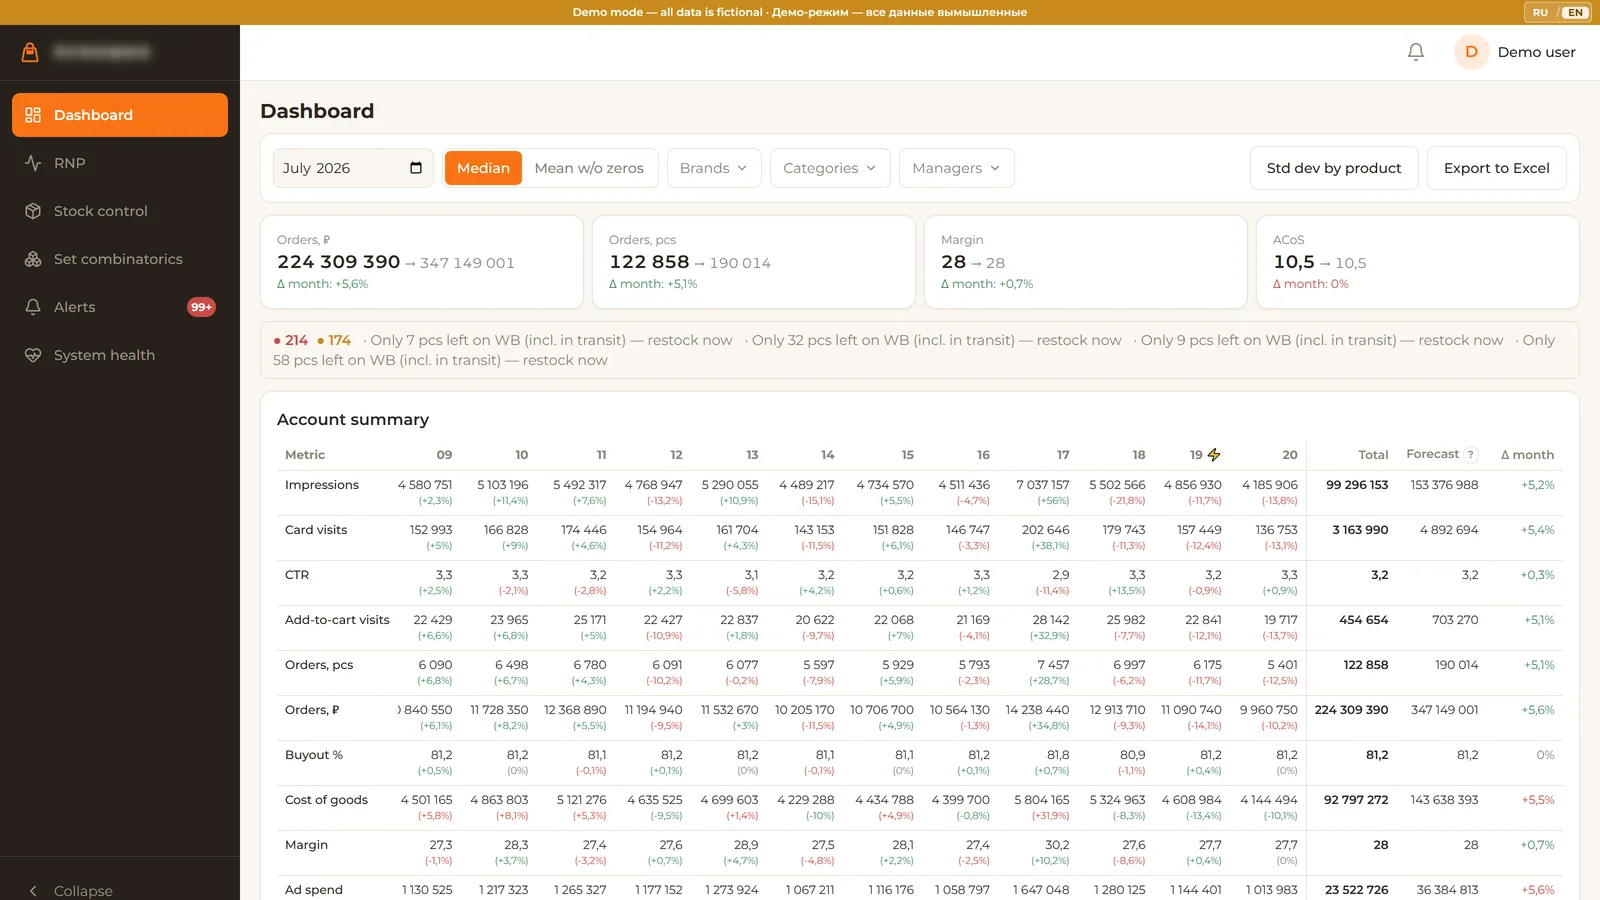
The pulse board is the daily per-SKU control panel: sales funnel, ad economics, stock and prices, about 60 columns per SKU, virtualized so 763 rows scroll like silk. The dashboard answers the owner's question: how does the month end if we keep moving like this?
763 rows × ~60 columns with sticky SKU column and configurable traffic lights. A card mode for working by exception. Each SKU opens into a card: sales, ads, stock, prices and comments in 7 / 14 / 30-day windows.
The marketplace funnel export lands by drag-and-drop. Columns are matched by fuzzy mapping; a renamed column triggers a confirm dialog instead of a silent misread. Broken rows are rejected individually, never the whole file.
TrueStats and marketplace revenue are compared daily. A gap over 5% raises a banner. In production this caught a real 13.31% mismatch on the first battle run.
Cabinet and category economics from file, API or both merged per SKU. A month-end forecast from the 15-day trend. Expense metrics invert their coloring: growing ad spend is red, not green. Response: 61 ms cached, 101 ms cold.
The backend renders showcase tabs into the familiar spreadsheet: main board, season view,
distribution, price proposals, stock control, alerts. Writes are RAW only, so barcodes do
not turn into 2.05E+12. Manual edits flow back by a diff-pull every 10 minutes,
and the render never overwrites a human's cell. A button in the sheet posts new prices back
through a token-checked webhook.
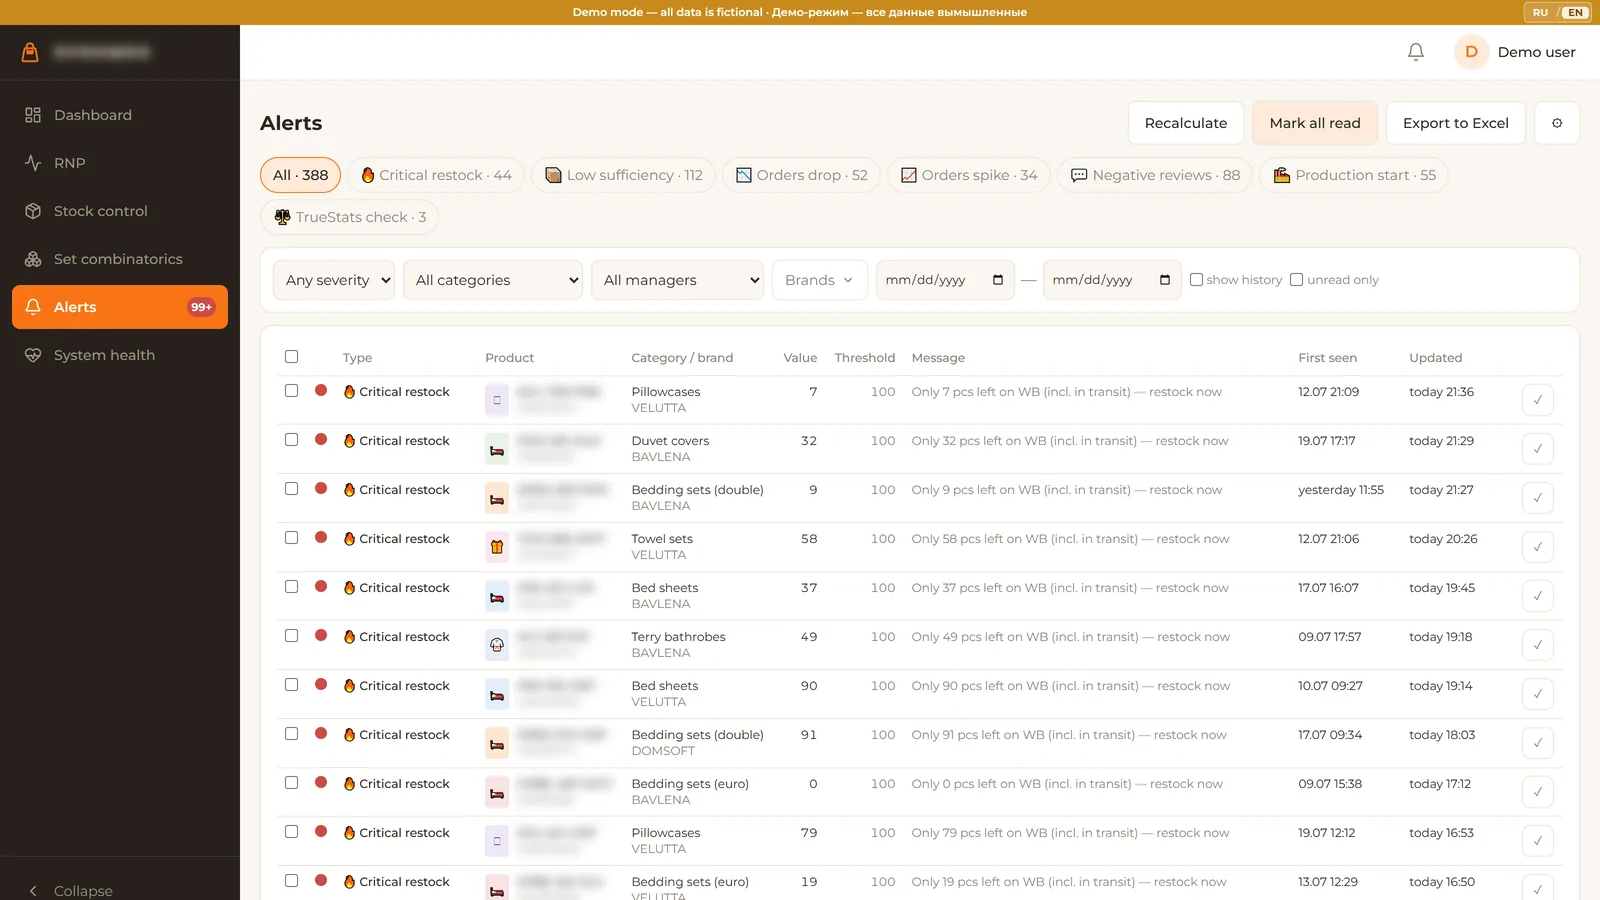
Problems should find people, not wait to be found. Seven deterministic alert types watch the business; a health page with traffic lights watches the system itself.
| Alert | Trigger | Detail |
|---|---|---|
| Urgent restock | ≤100 units left on the marketplace | Always red, always pinned to the top of the feed. |
| Low sufficiency | coverage below threshold | Uses the same sufficiency contract as the restock table. One formula, one truth. |
| Orders drop | 3-day speed vs 10-day speed, ≥30% down | Catches a dying SKU in days, not weeks. |
| Orders spike | 3-day speed sharply up | A spike is a restock signal too: sell it while it flies. |
| Negative reviews | new 1-3 star reviews | Popup with the review texts, server-side pagination. 1,447 negatives were on file at acceptance. |
| Production start | <90 days of runway | Counts the 60-day production cycle backwards from the projected stockout, softened off-season. |
| Data mismatch | TrueStats vs WB gap >5% | The system distrusts its own inputs before it lets you trust its outputs. |
An alert is an episode: active, resolved, reactivated same-day if the condition returns. Zero duplicates by design. Acknowledgements are per user, so one manager's "seen" does not hide the problem from another.
If marketplace data is older than 24 hours, the whole alert recalculation is skipped. No alerts computed on stale data: silence is more honest than noise.
The first production run surfaced 388 active alert episodes. That is the backlog of problems that used to be invisible. The feed sorted them; urgent restock came first.
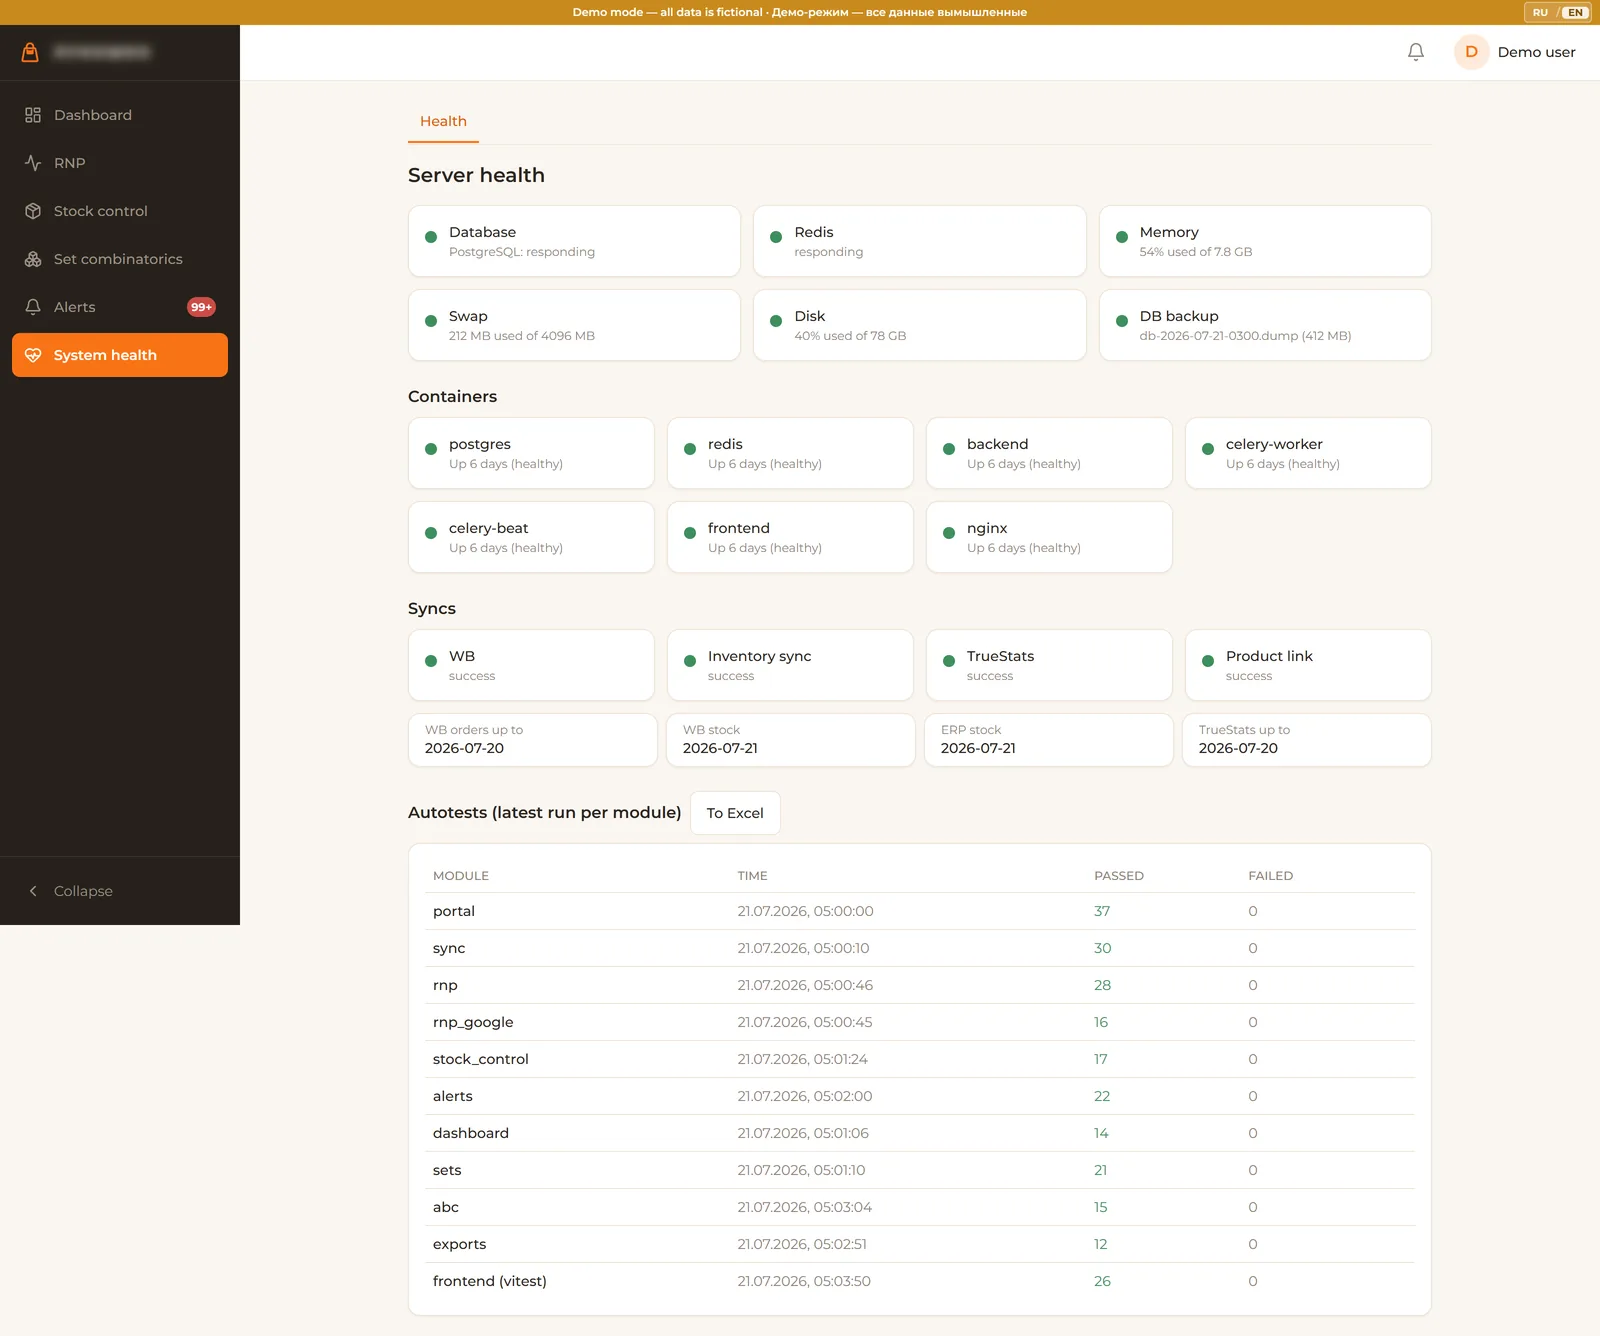
A cron job re-runs all 212 backend autotests every morning at 05:00 in a clean, separate database. The result lands in a table and shows on the Health page, next to traffic lights for containers, memory, disk and backup freshness. The ERP proves to its owner daily that it still works. Not a promise, a green light.
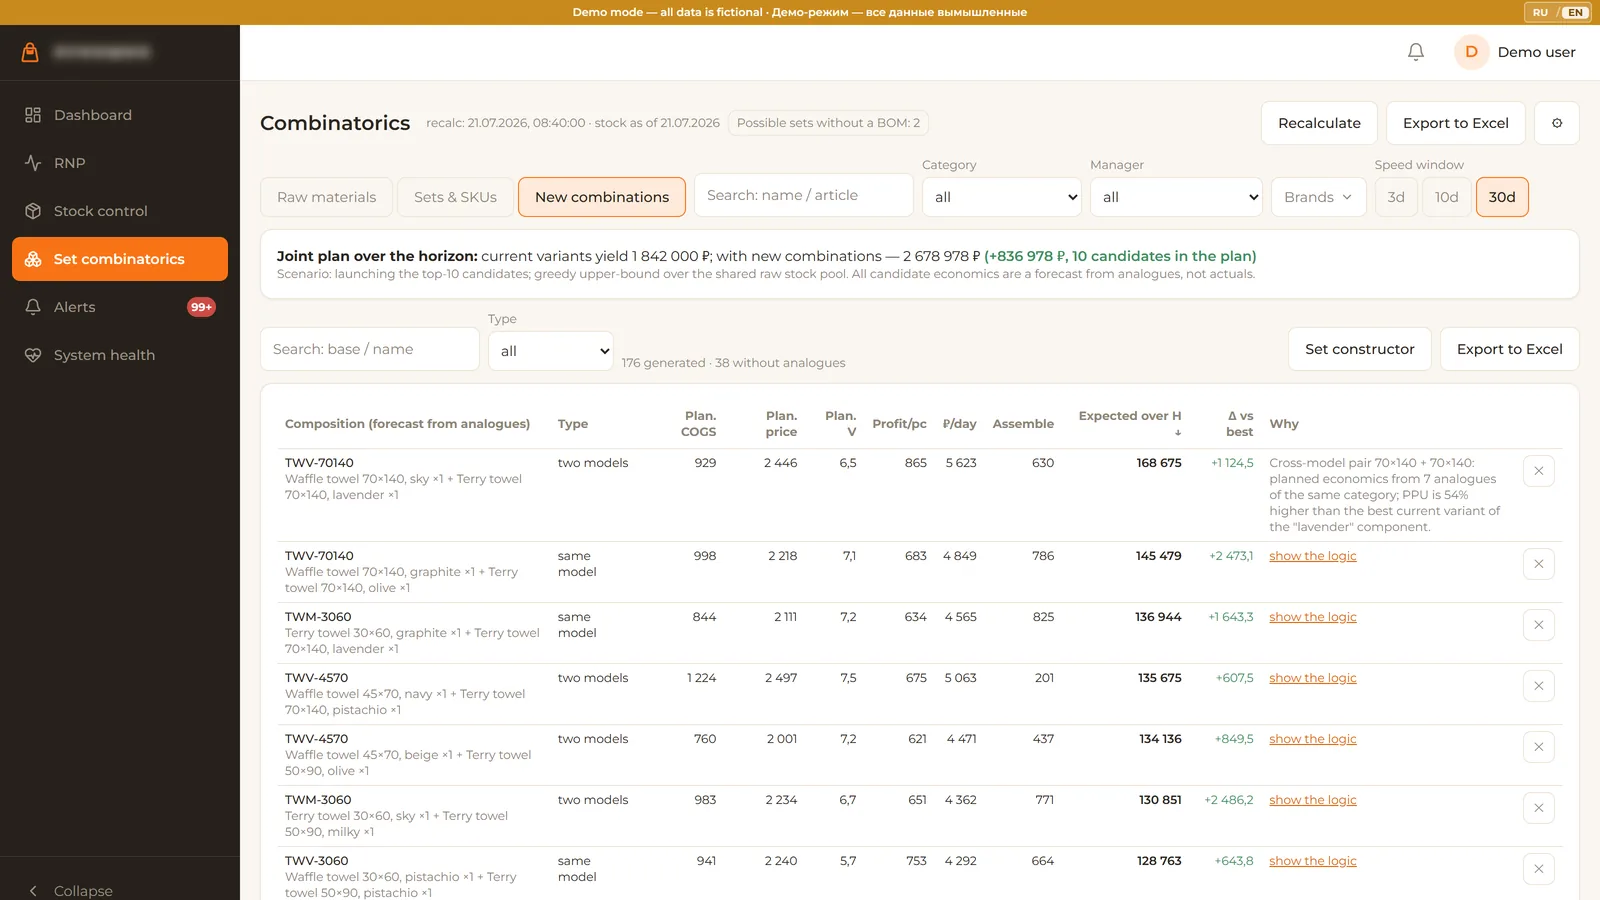
Towels sell alone and in sets. The same raw item can go out a dozen ways, each with its own price per unit, margin and stock cap. The client used to hold this combinatorics in his head. Now the system computes it, and explains every suggestion in a "Why" column.
For each raw towel: all its sell variants, single or inside any of 349 set recipes pulled from MoySklad tech cards. Per variant: price per unit, margin, cap by current stock, the limiting component, and a greedy allocation plan. 294 raw items × 349 recipes = 1,813 variants, computed in 3.0 seconds and verified by hand against SQL on production data.
The client's merchandising rule, encoded: pink does not sell alone, but alongside grey it flies. The engine parses the model base from the article, pairs a top color with a slow mover (same base), crosses bases, and estimates the economics of each candidate from analogs.
Every candidate carries a human-readable rationale: which color pulls, which stock it unfreezes, what the expected per-unit economics are. Optimization is deliberately greedy, not an LP solver: the client can follow every step, and trust beats the last percent of optimality.
A floating ABC classification by three criteria at once: profit, revenue and orders, with configurable 80/95 thresholds guarded by a database-level check.
The first production run put numbers on the intuition: class A is 134 SKUs, 17.6% of the catalog, holding 80.2% of the profit. The classes are cross-checked against the analytics service's own ABC, and SKUs that are loss-making or lack data are shown in explicit buckets with the reason broken down, not silently dropped.
Classes are computed once and served by contract: the pulse board and the restock table pull the letter without recomputing anything. The TOP rule of the restock table feeds on exactly these classes.
An A-class SKU below 90% of its buffer jumps to the top of the supplier order, above any C-class SKU with a worse percentage. The business protects the 134 SKUs that pay for everything else. That priority is a tested rule, not a habit in someone's head.
The buffer says what is missing. The order module says where to get it and by when, then produces the exact Excel file the producer in Uzbekistan expects.
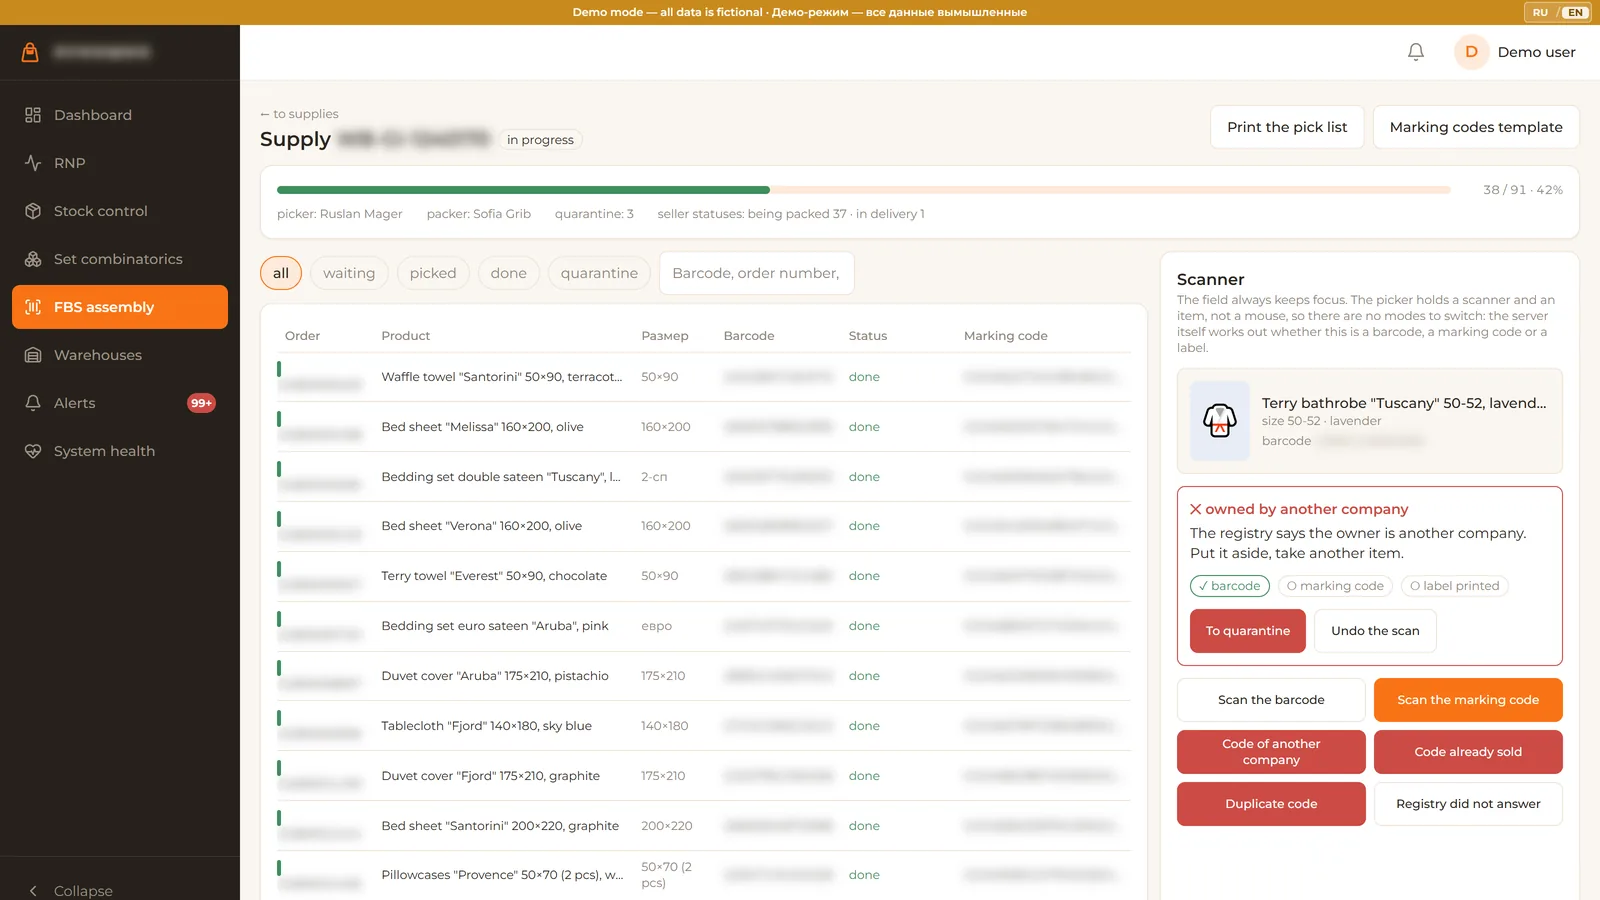
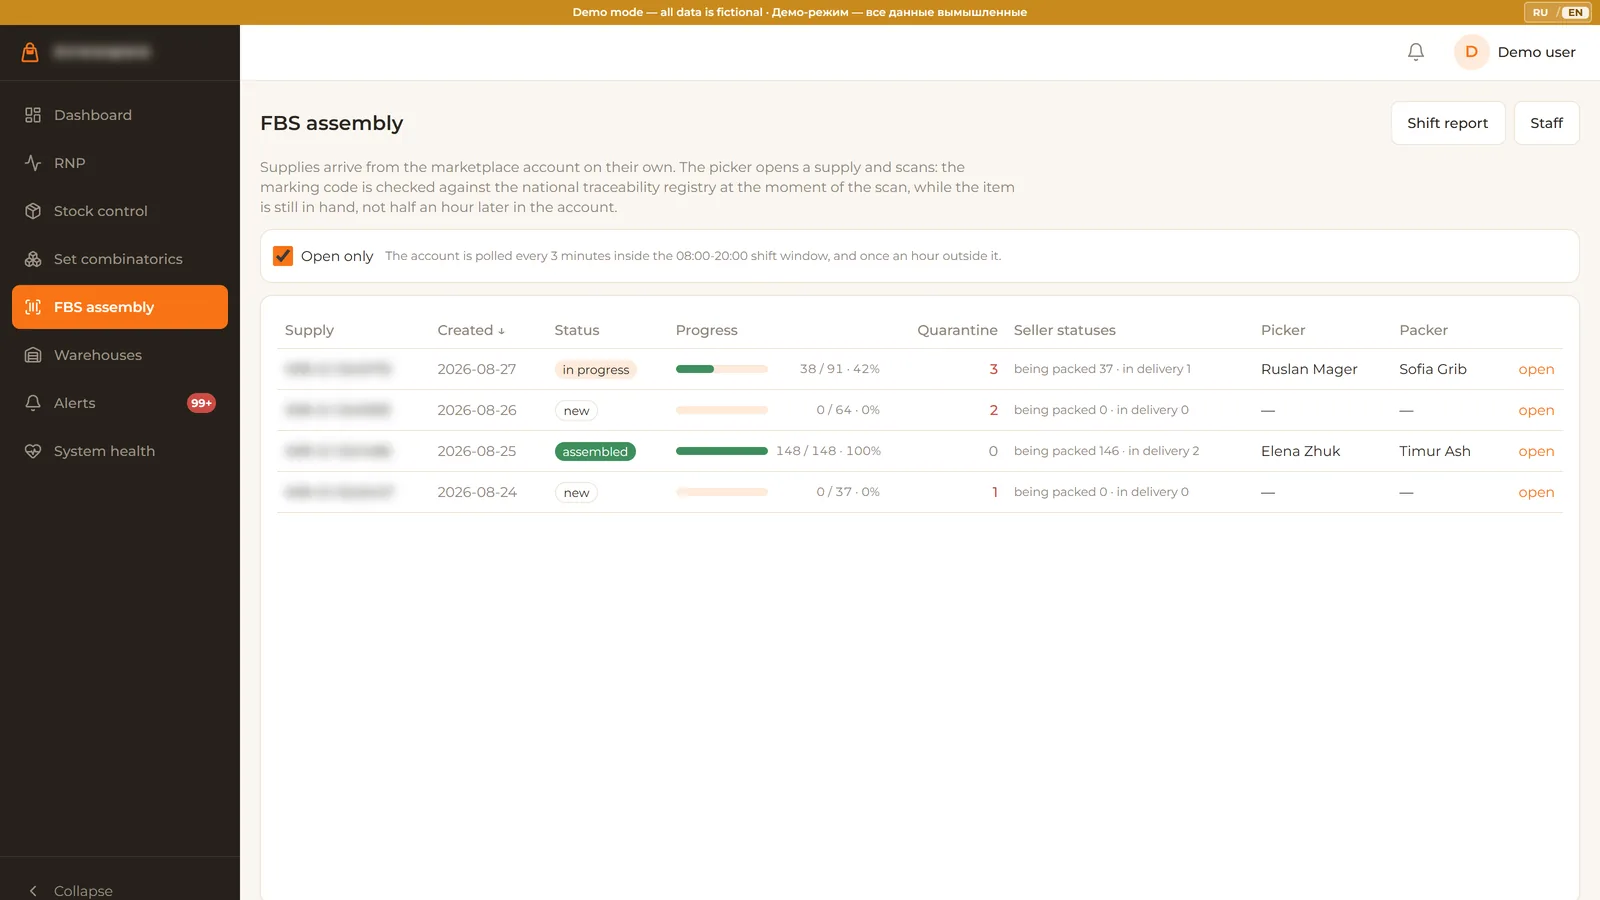
Q(L) = max(0, ceil(V_plan × (N + L) × 1.1 - total stock)). Pass one checks the producer's warehouse: enough there means mode "from stock", lead 14 days. Otherwise mode "production", lead 74 days (60 production + 10 delivery + domestic legs), with a note when part of the quantity is available now.The warehouse packed orders by hand: the marketplace account, a pick list, Excel, a scanner into Excel, a manual replacement of hidden separators and an upload of the template back. The real loss of time started after that upload: the marketplace checks every code against the national traceability registry and rejects some of them, and people go looking for those items through the boxes. The module moves the check to the moment of the scan: the picker learns about a bad code while the item is still in their hands.
| Verdict | What the picker sees and does next |
|---|---|
| Code accepted | green, the order is closed, the label goes to the printer |
| Accepted unchecked | yellow: the registry did not answer, the code is accepted by setting and rechecked at night |
| Owned by another company | put it aside, take another item |
| Already sold | the code has left circulation: put it aside, take another item |
| Not in circulation | the code was never put into circulation: send it to quarantine |
| Blocked | quarantine |
| Unknown to the registry | quarantine |
| Duplicate | red, with the number of the owning order: the label can be reprinted from there |
| Another product | the code belongs to another card: scan the barcode first |
The order of the checks matters. A foreign sold code has several reasons to fail, and the picker needs to hear one: the one they can act on.
The server classifies the input itself, barcode, marking code or label, and moves the state of the order. A person holding an item has nothing to switch modes with.
Every press carries its own identifier, and a repeated request returns the same answer instead of a recomputed one. Otherwise the picker would see "this code is already scanned" in response to their own scan.
A repeated import refreshes the marketplace fields and never touches ours: status, batch, scans and codes. The nightly run does not erase what people did.
An order with a bad code goes to quarantine with a reason rather than disappearing from the list. The warehouse lead sees how many orders are stuck and why.
The module admin right allows adding and disabling pickers without the portal administrator. Disabling only, never deletion: scans and shift reports hang on the person.
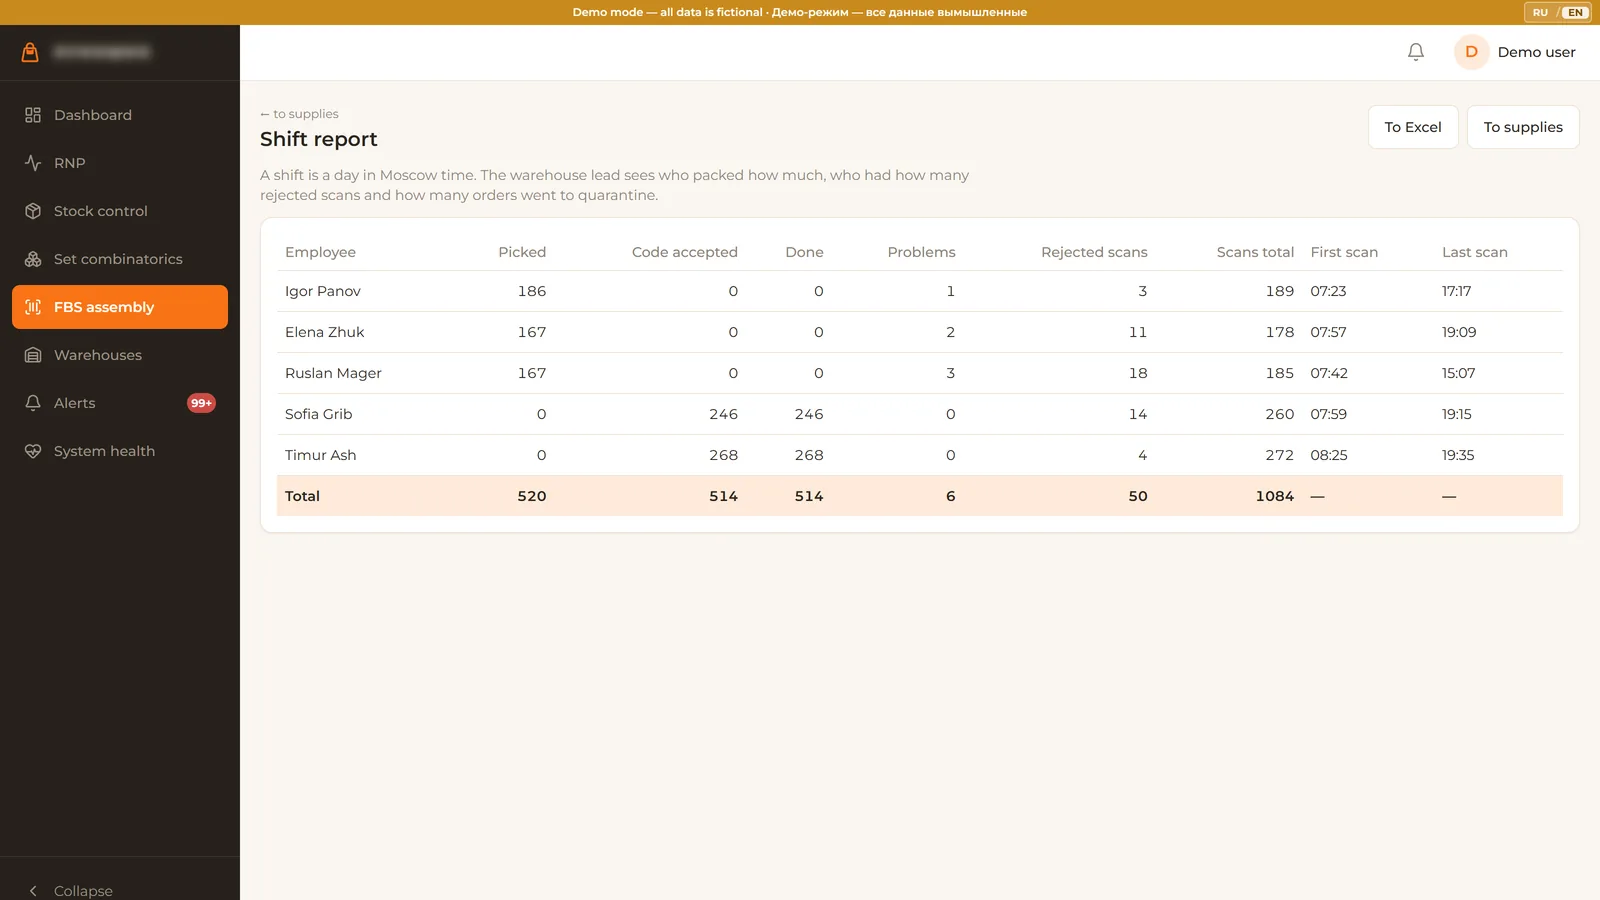
A shift is a day in Moscow time. Per employee it shows what was picked, which codes were accepted, what is done, how many problems, how many rejected scans, and the first and last scan.
Silent degradation is unacceptable here. If the registry token dies, the module raises a system alert and keeps working in "accepted unchecked" mode, marking such codes honestly. It is exactly a silent failure that would cost the rejection at the marketplace this whole module exists to avoid.
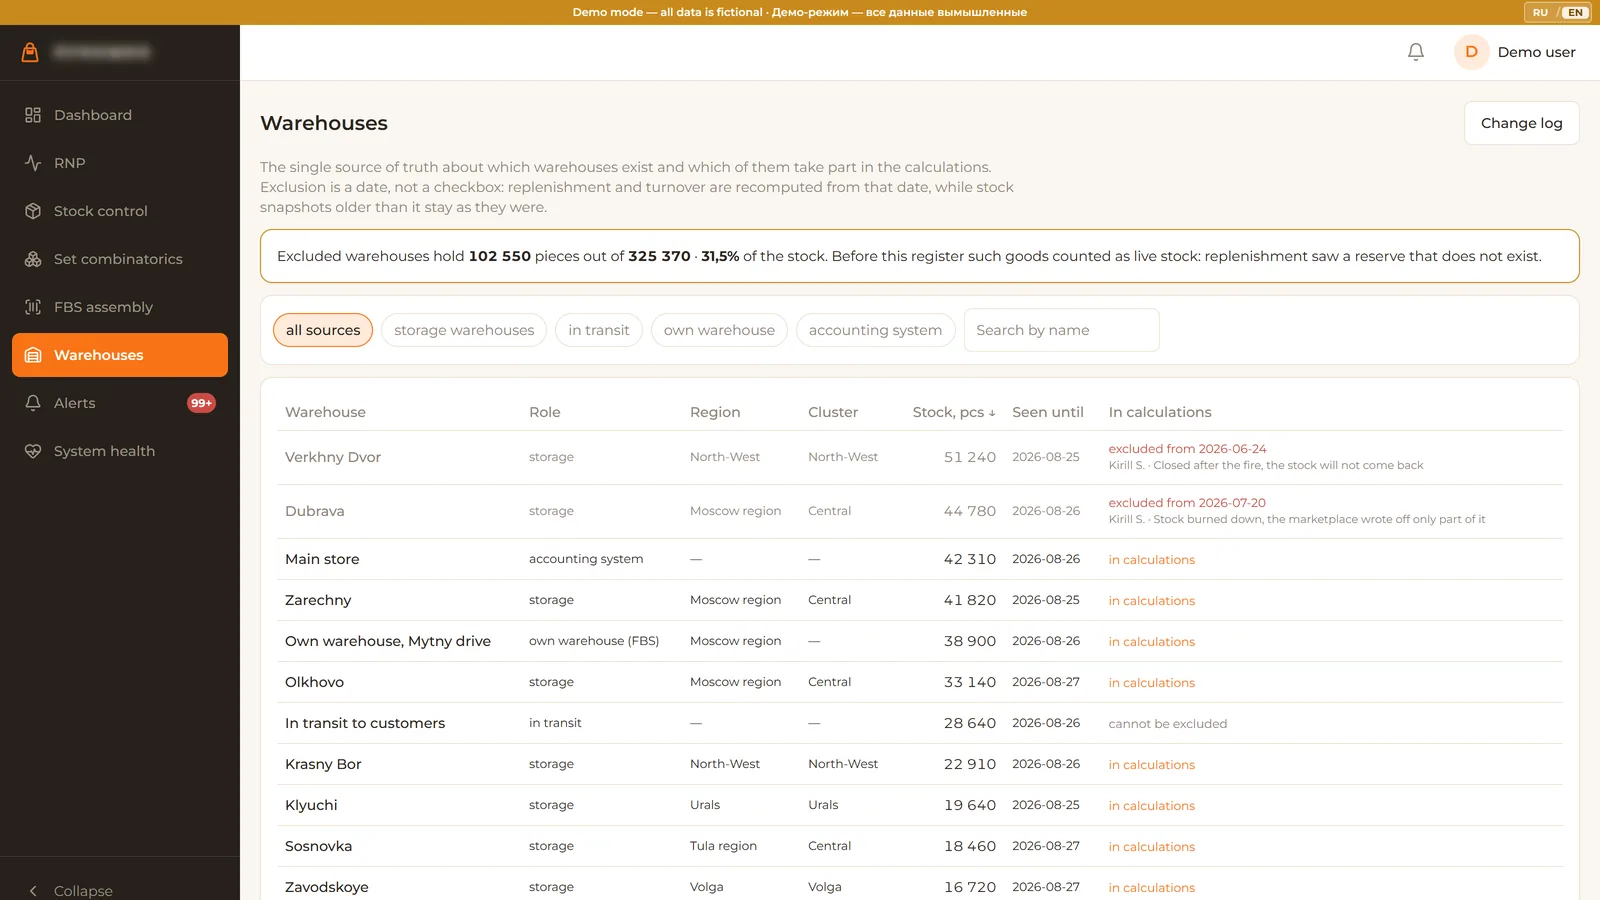
There was no warehouse register in the system: the warehouse name lived as a bare string inside the daily stock snapshots, and there was nothing to switch a warehouse off with. The client kept a noticeable share of goods in warehouses that no longer exist, while replenishment, turnover and the daily pulse counted those goods as live stock.
The client asked to state from which day a warehouse is off and to recompute the history from that day. Stock snapshots older than the date stay as they were: the past is not rewritten.
Two fields on the warehouse row only answer "who switched it off right now". The client's question was a different one, and the history answers it: who, when, from which date and for what reason.
Saving the same values again adds nothing to the log. Otherwise in a week it fills with noise and stops answering the original question.
Pseudo-warehouses for goods in transit and the drop-off points cannot be excluded: they hold no stock, they mark its movement. An attempt to switch such a row off is rejected by the server, not only by a guard on the front end.
Business analysis first. Every stage started as a self-contained written spec with data contracts, formulas and acceptance criteria. Implementation went step by step under iron rules written down after the previous ERP project. Each change lands as a small reviewable step.
The automatic seasonal coefficient currently equals 1: the marketplace API keeps only about 6 rolling months of history, so year-over-year seasonality is physically unavailable. The system says "not enough history" and accumulates its own. The Google service key was not yet handed over at acceptance, so that module soft-skips instead of failing. Competitor parsing is coded but waits for a proxy. All three are written in the acceptance report, not discovered later.
| Area | Before | After |
|---|---|---|
| Restock decisions | The owner's personal Excel, daily, by feel. Held on one person. | TOC buffers with traffic-light zones per SKU, self-correcting by ±1/3, every change confirmed by a human. |
| Data | Three services plus manual exports. No single picture. | One PostgreSQL, a nightly conveyor with freshness gates and idempotent imports. |
| Problem discovery | By eye, when someone happened to look. | 7 alert types; 388 previously invisible episodes surfaced on day one, urgent restock always on top. |
| Month economics | Clear after the month ended. | A dashboard with a month-end forecast from the 15-day trend, in 61 ms. |
| Set planning | Combinatorics in the owner's head. | 1,813 computed variants in 3.0 s, each new candidate with a written "Why". |
| Supplier order | Assembled by hand for every order. | Checkboxes plus one button: the supplier's exact Excel format, with history and snapshots. |
| Trust | "It should be working." | 212+26 autotests re-run every morning in a clean database, result visible to the client on the Health page. |
Business analyst and systems builder. I start with the business process and the data contract, then automate. This ERP went from agreed spec to production, and it runs the client's restock on Goldratt's buffers instead of gut feel.